AI for physical process transformation
AI for physical process transformation
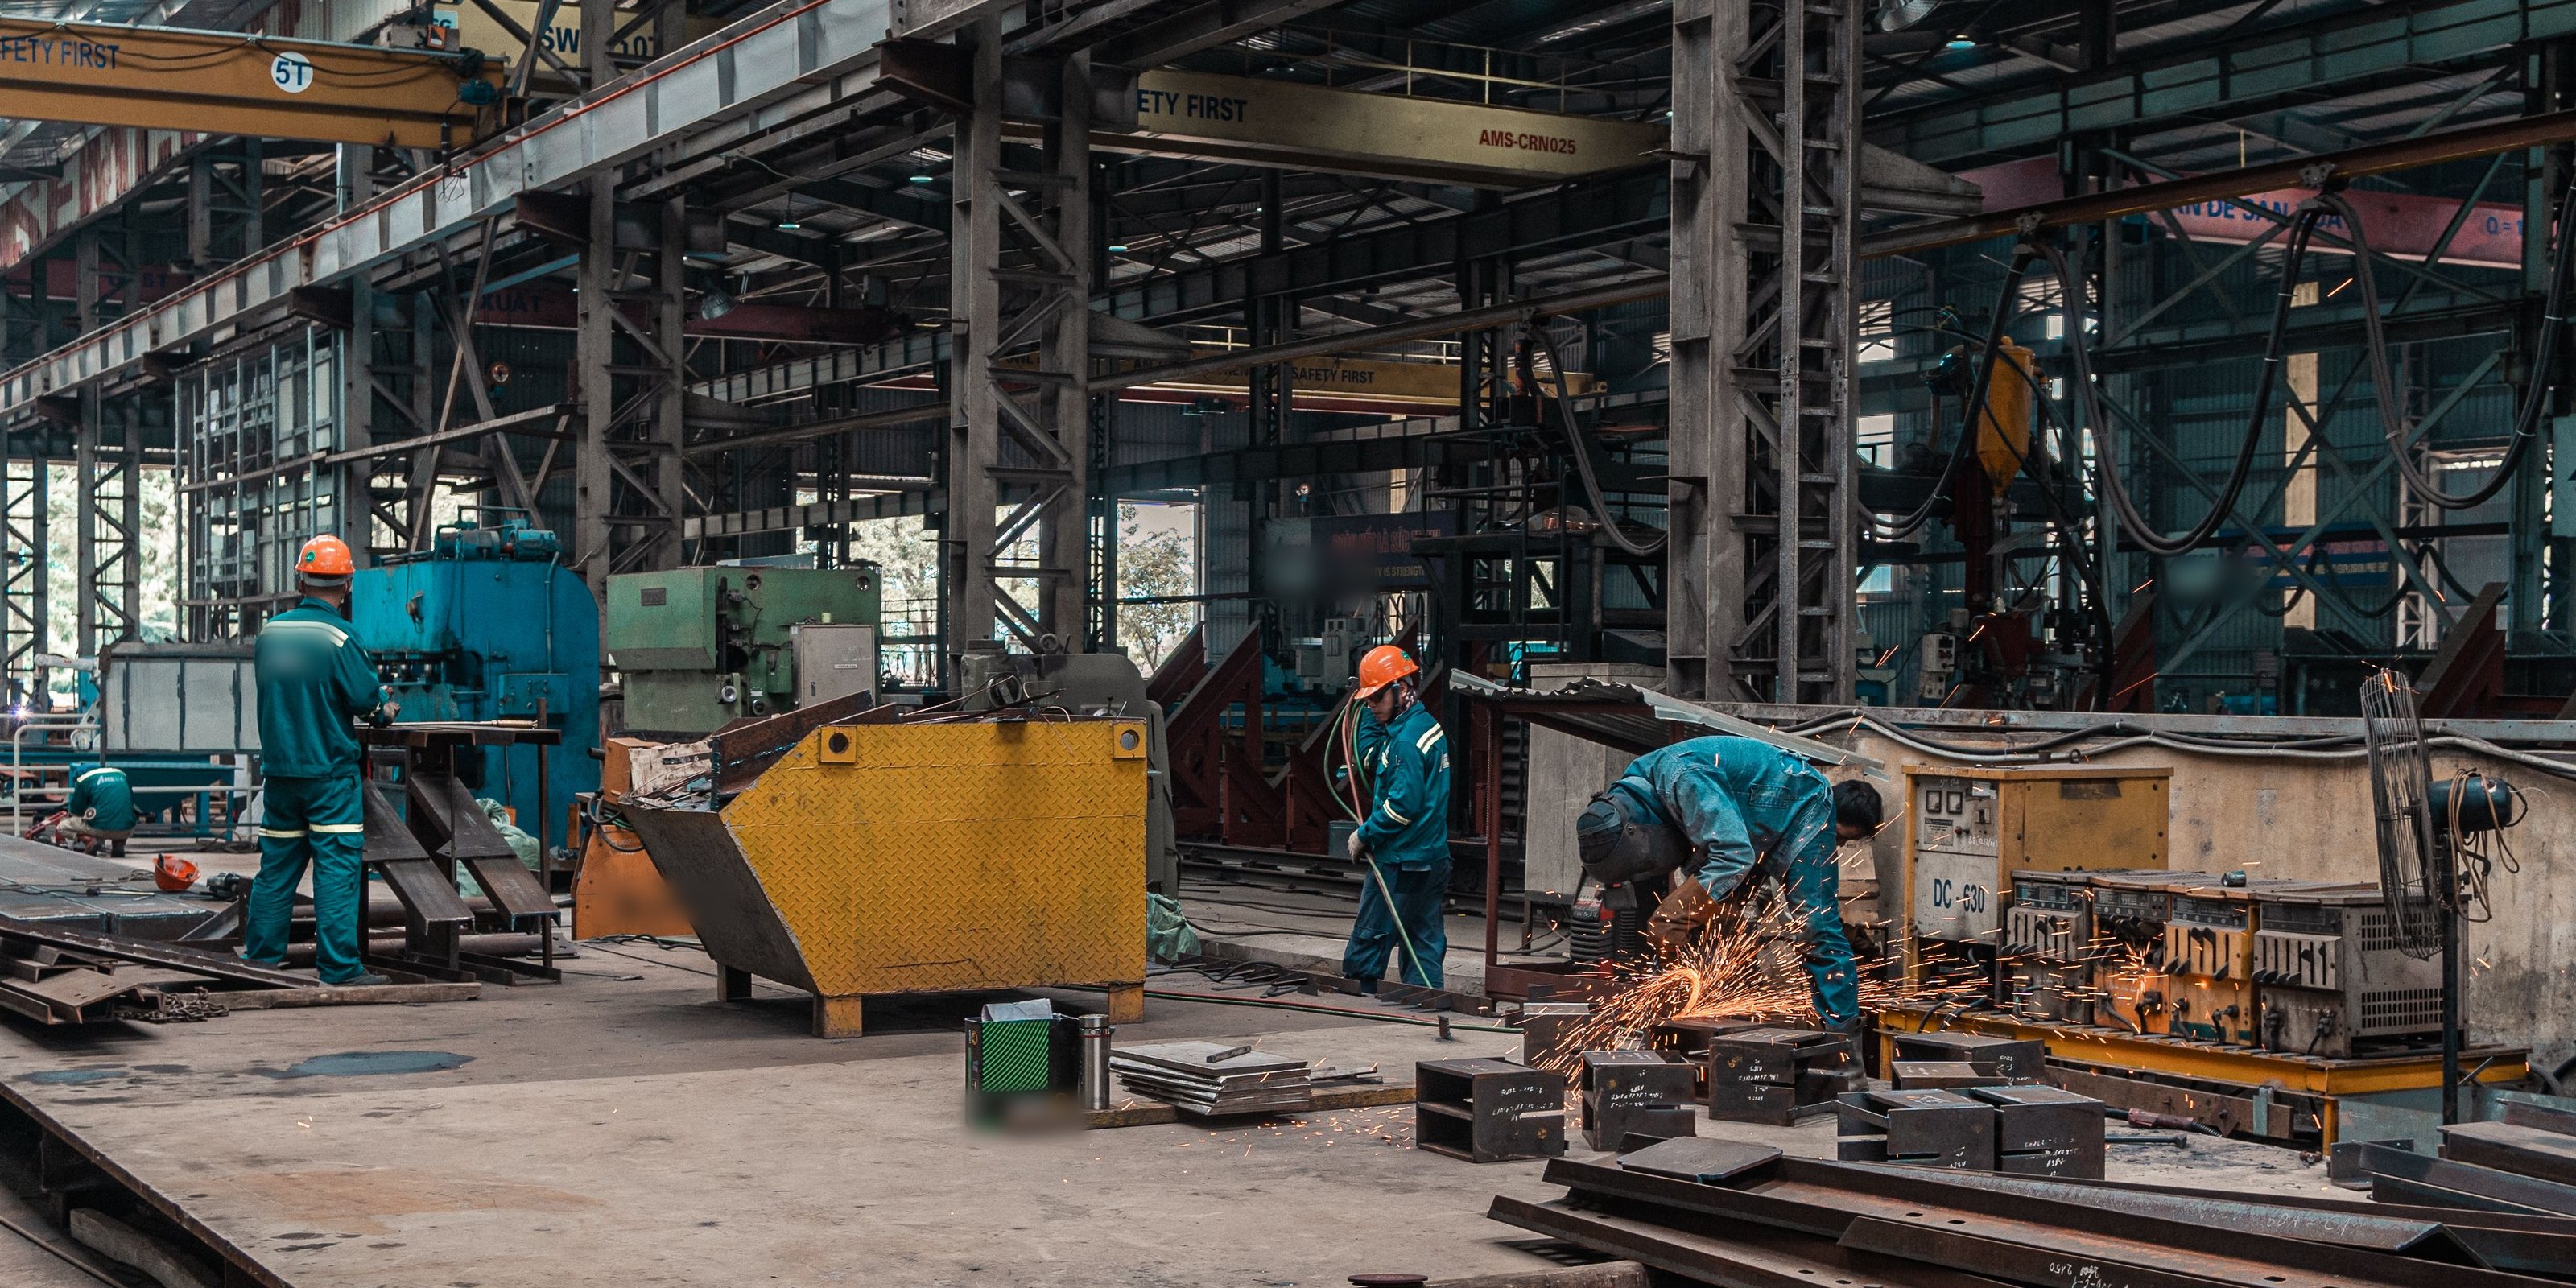
Cobalt measures how work happens on a manufacturing floor, using camera video alongside the plant's existing data. It shows where the time goes, what to change, what each change is worth, and whether the change held.
How work actually happens is rarely written down. Most plants run on what people know, and decisions about staffing, layout and automation get made without a measured baseline.
From baseline to tracked result
- 01
Baseline
Video from the floor, joined to existing plant data such as MES and ERP records, is converted into measures for each station: the share of the shift spent on value-added work (the work that changes the part), how long a unit takes and how much that varies, units finished per day against plan, and time spent on rework. In manual welding, arc time typically runs 15 to 30 percent of the shift.
Cams 1 to 4 · 4 stationsTime use by station
Share of shift, ten shifts pooled
Fit-up Station A0% value-added39%29%13%13%Weld Booth 30% value-added18%38%17%11%16%Weld Booth 50% value-added26%37%14%9%14%SAW long seam0% value-added31%36%12%15%- Value-added work
- Support work
- Waiting
- Walking
- Breaks and idle
- 02
Root cause
Lost time is broken down by cause: waiting for parts, for the crane, for an inspector, or walking to the tool crib. The system identifies the bottleneck, the one station that limits the output of the whole line.
Fit-up Station A · Cam 1Idle by cause
Fit-up Station A, minutes per shift
Waiting for the crane0Walking to the tool crib0Waiting for an inspector or a drawing answer0Waiting for consumables0Load by station, scheduled hours as a share of available62% Cut and form58% Roll105% Fit-up81% Weld94% NDE66% Finish - 03
Propose changes
The plant receives a ranked list of specific changes. Each item links to the video behind it, by camera and time, so supervisors can check it.
Cams 1 to 4 · 10 shiftsRanked changes
Estimated value in canisters per week
- 1+0.4 / week
Stage kits and consumables with one material handler
Fit-up, weld boothsCam 1 · 07:12Cam 3 · 09:41 - 2+0.3 / week
Book the hold-point inspector when fit-up starts, not when welding ends
Fit-upCam 1 · 10:26 - 3+0.2 / week
Check the fit-up gap before the assembly leaves the station
Fit-upCam 1 · 13:05Cam 4 · 13:48 - 4+0.2 / week
Adopt the best-observed circ seam sequence at all four booths
Weld boothsCam 3 · 08:15Cam 4 · 08:22
Each item links to the video behind it, by camera and time.
- 1
- 04
Quantify
A working model of the floor estimates what each change is worth in units per day and cost per unit. The same model is used to test larger decisions, such as a second shift or a welding robot, against the measured baseline.
Throughput model
With changes 1 to 5, against the baseline
canisters per week3.3 → 3.3ConstraintFit-up → NDECost per unit$21,400 → $21,400Cut and form78%Roll73%Fit-up92%Weld96%NDE100%Finish83%Load: scheduled hours as a share of available hours. Relieving fit-up moves the constraint to NDE.
- 05
Track
Measurement continues after a change is made. The core measures update continually, so the plant can see whether the change was adopted and whether the number moved.
Fit-up Station A · Cam 1 · 8 weeksWeek-over-week time study
Fit-up Station A, share of shift by week
12345678Change made after week 4Material handler starts staging kitsValue-added work39% → 0%
01 / 05
Baseline
Video from the floor, joined to existing plant data such as MES and ERP records, is converted into measures for each station: the share of the shift spent on value-added work (the work that changes the part), how long a unit takes and how much that varies, units finished per day against plan, and time spent on rework. In manual welding, arc time typically runs 15 to 30 percent of the shift.
Time use by station
Share of shift, ten shifts pooled
- Value-added work
- Support work
- Waiting
- Walking
- Breaks and idle